Lightning detection networks use ground sensors to work out where each strike landed. I wanted to know how closely two of them agree on location over NSW. One is NSW government data, likely supplied by a commercial network. The other is Blitzortung, a free network of home-built receivers run by volunteers around the world. I recorded Blitzortung live for two weeks in November 2026 and compared it strike by strike with the government data over 109 hours when both were available. The comparison covers the whole state plus two boxes of the same size, one around Mudgee and one around Sydney.
WHERE THE DATA COMES FROM
Government data. This is NSW government lightning data, available to download with a login, covering the last 72 hours at a time. It covers all of Australia and nearby seas. Each strike has a position, a time to the whole second, and a peak current in kiloamps (kA) with a plus or minus sign. The source network isn’t named, and we don’t know where its ground stations are. It reports peak current and records many times more strikes than Blitzortung, which both point to a commercial network. Four downloads were combined for this comparison.
Blitzortung. About 2,700 home-built stations are listed worldwide. Each has an antenna tuned to very-low-frequency radio, which is where lightning’s radio burst is strongest, plus a GPS clock. Blitzortung’s servers locate each strike from the tiny differences in when its burst reached each station. I recorded the public live feed on my own server, keeping every strike in a box around NSW. Each record also lists the stations that located it, which is how Figure 1 was drawn.
Figure 1
Blitzortung Stations That Located NSW Strikes
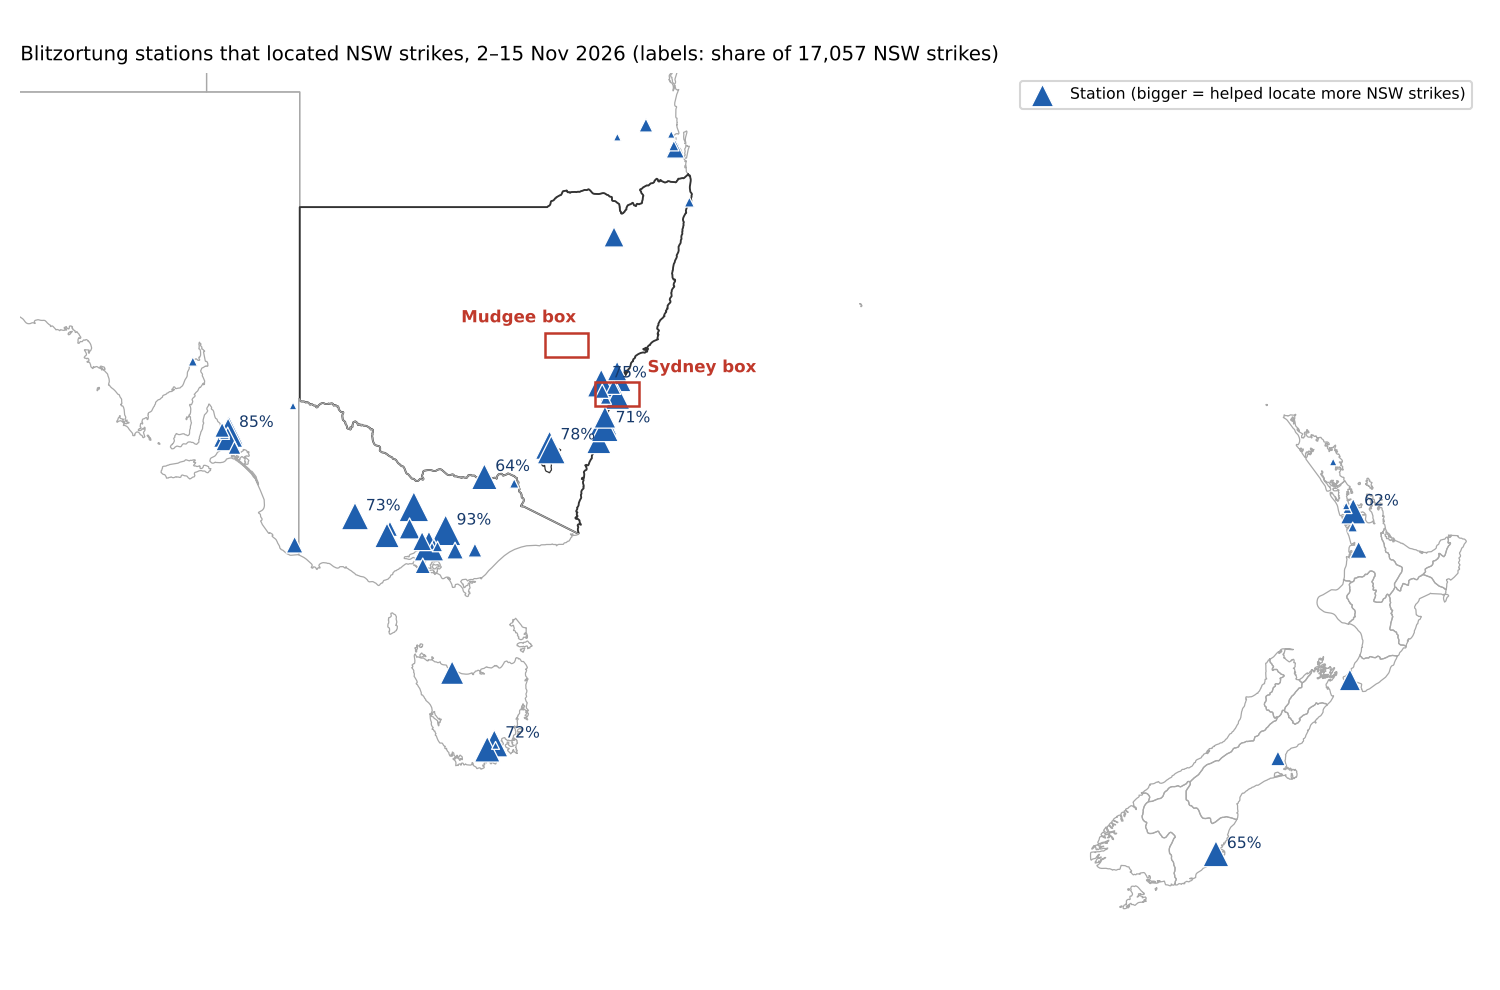
Note. Based on 17,057 strikes over NSW recorded from 2 to 15 November 2026, located using 146 different stations. Percentages show the share of those strikes the busiest stations helped locate. Most stations sit around Sydney, Canberra, Victoria, Adelaide, Tasmania and New Zealand. There are almost none inland in NSW.
PAIRING UP THE STRIKES
Blitzortung times each strike to the microsecond, but the government data only gives whole seconds. The government data simply drops the fraction of a second, and the two clocks otherwise agree to within about 10–20 milliseconds. So each Blitzortung strike was compared only with government-data strikes in the same second, and paired one-to-one with the closest one, up to 10 km away.
Every strike in the government data also has an ID number, like 475711975. If those IDs were handed out in the order the strikes happened, the lowest ID within a second would be the earliest strike, and that would pair strikes more precisely. They aren’t. In the first test, the IDs matched Blitzortung’s time order in only 2,278 of 4,499 checks, about half, which is what chance gives. Strikes that share a second were therefore paired by distance alone.
In a busy storm, two unrelated strikes can land close together in the same second by chance. To measure how often that happens, government-data time can be shifted by a set number of seconds and paired the strikes again (Figure 2). With the true times, 10,234 NSW strikes paired up. Shifted by 2 seconds or more, only 326–676 pairs turned up, and those sat further apart, at a median of 5–6 km rather than 3.1 km. Those few hundred are the chance level. A 1-second shift still found 1,272–2,620 pairs, because one lightning flash often has several strokes spread across a second or so.
Figure 2
Pairs Found When the Government Data Is Shifted in Time
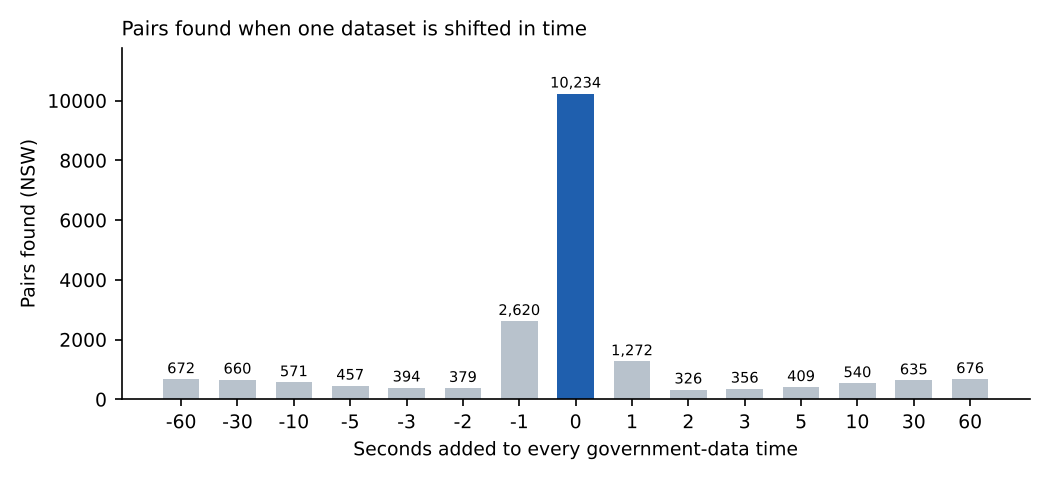
Note. NSW land strikes only. With no shift, the pairs are almost all real. The bars at 2 seconds or more show how many pairs would appear by coincidence, about 3–7% of the real number.
The government data is used as the reference below because it’s the more sensitive network. Neither network is ground truth, though, so the offsets show how far apart the two networks are, not which one is right.
WHAT WAS COMPARED
The two datasets overlapped from 8:24 PM on 2 November to 9:49 AM on 5 November, and from 8:38 PM on 11 November to 8:02 AM on 15 November 2026. My recording had a few gaps of 6 hours or more with nothing logged in NSW, at least one of them an outage, so those stretches were left out. That leaves 109 hours. I chose these windows as they presented storms over Mudgee and Sydney.
The two boxes are the same size, 130 km east to west by 72 km north to south. The Mudgee box is centred on Mudgee and reaches from 5 km west of Wellington to past Rylstone, and from 10 km north of Gulgong to past Hargraves. The Sydney box is centred on the Sydney CBD and reaches from west of Penrith to about 60 km out to sea, and from Richmond to Campbelltown. Both include every strike inside the box, over land or sea. The NSW figures count strikes over land in NSW and the ACT only.
THE RESULTS
Table 1
Government Data and Blitzortung Strikes Compared Across NSW, Mudgee and Sydney
| All NSW/ACT | Mudgee box | Sydney box | |
|---|---|---|---|
| Government data strikes | 157,990 | 1,723 | 10,009 |
| Blitzortung strikes | 14,154 | 200 | 2,050 |
| Caught by both | 10,234 | 173 | 1,450 |
| Government data only | 147,718 | 1,555 | 8,616 |
| Blitzortung only | 3,920 | 27 | 600 |
| Share of government-data strikes Blitzortung caught | 6.5% | 9.8% | 13.9% |
| Distance apart, mean ± SD | 3.6 ± 2.3 km | 3.0 ± 2.4 km | 3.6 ± 2.1 km |
| Distance apart, median | 3.1 km | 2.0 km | 3.2 km |
| Distance apart, 90th percentile | 7.1 km | 6.5 km | 6.6 km |
| Average shift east–west (± SD) | 1.7 km east (± 2.2) | 0.9 km east (± 1.5) | 2.2 km east (± 2.6) |
| Average shift north–south (± SD) | 1.8 km south (± 2.7) | 2.1 km south (± 2.8) | 0.9 km south (± 2.2) |
| Spread is longest along | NE–SW (2.8 vs 2.1 km) | North–south (2.8 vs 1.4 km) | East–west (2.7 vs 2.1 km) |
| Storm days in the comparison | 9 days with strikes | 3, 14 and 15 Nov | 3, 13 and 14 Nov |
Note. Distances and shifts are Blitzortung’s position relative to the government data’s position for the same strike. The spread row compares the standard deviation along the longest and shortest directions of the scatter. Totals can differ slightly where a pair straddles the edge of an area.
Table 2
Distance Between Paired Strikes
| Distance apart | All NSW/ACT (10,234 pairs) | Mudgee box (173 pairs) | Sydney box (1,450 pairs) |
|---|---|---|---|
| 0–500 m | 322 (3%) | 20 (12%) | 39 (3%) |
| 500 m–1 km | 678 (7%) | 21 (12%) | 61 (4%) |
| 1–2 km | 2,043 (20%) | 40 (23%) | 262 (18%) |
| 2–3 km | 1,956 (19%) | 24 (14%) | 301 (21%) |
| 3–5 km | 2,630 (26%) | 29 (17%) | 482 (33%) |
| 5–7.5 km | 1,761 (17%) | 26 (15%) | 196 (14%) |
| 7.5–10 km | 844 (8%) | 13 (8%) | 109 (8%) |
Note. Each pair is counted in one band only. Nothing goes past 10 km because strikes further apart than that weren’t paired. Allowing pairs up to 40 km apart adds 3,348 NSW pairs, mostly between 10 and 40 km apart; these are either badly placed strikes or different strokes of the same flash, so they’re left out.
ACROSS NSW
The government data logged about 11 times as many NSW strikes as Blitzortung, and Blitzortung caught only 6.5% of them. When both caught a strike, they put it a median of 3.1 km apart. On average Blitzortung sat south-east of the government data, about 1.7 km east and 1.8 km south.
Figure 3
Government Data and Blitzortung Strikes Across NSW
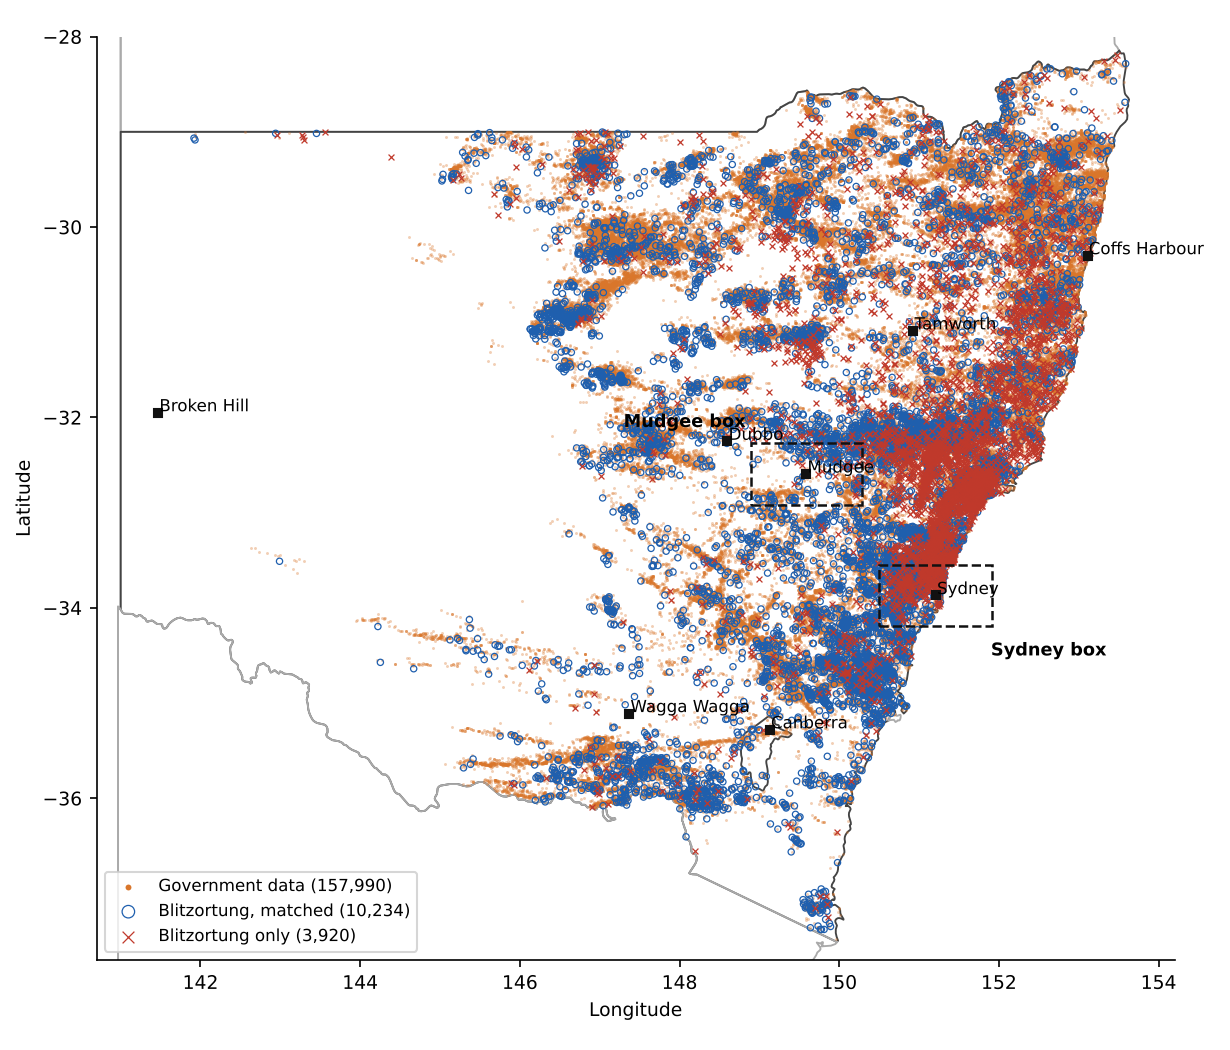
Note. Orange dots are government-data strikes, blue rings are Blitzortung strikes that paired with a government-data strike, and red crosses are Blitzortung strikes with no government-data strike within 10 km in the same second. Dashed boxes mark the Mudgee and Sydney areas.
Figure 4
Offsets Between Paired Strikes in NSW
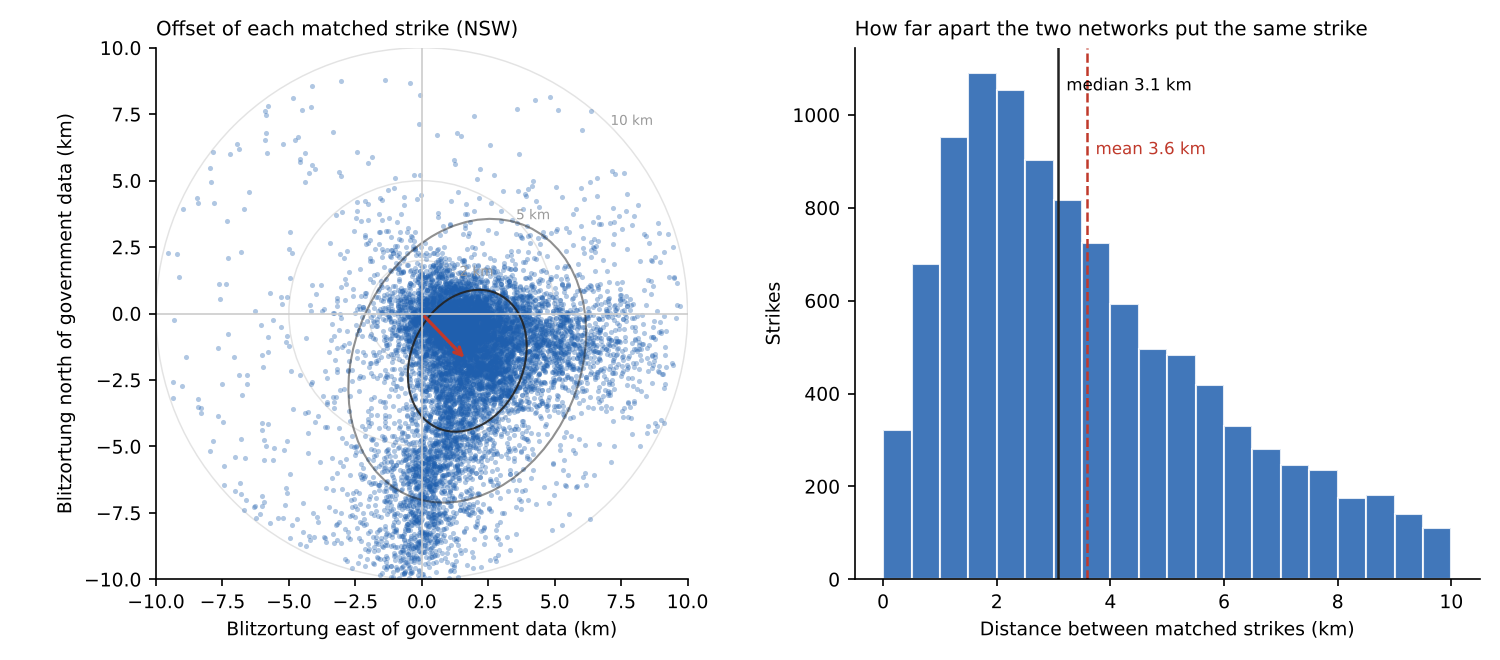
Note. Left: each dot is one paired strike, placed by where Blitzortung put it relative to the government data. The red arrow is the average shift, and the ellipses cover about 39% and 86% of strikes. Right: how far apart the two positions were.
STRIKE STRENGTH
Strength makes a big difference to whether Blitzortung records a strike at all. It caught 23% of strikes the government data rated at 40 kA or more, but only 3–4% of strikes under 10 kA.
Figure 5
Share of Government-Data Strikes Also Recorded by Blitzortung, by Peak Current
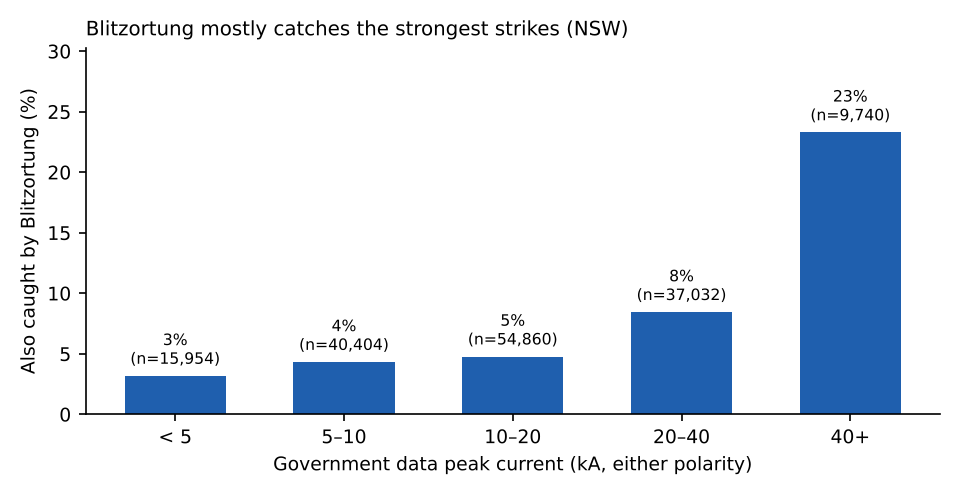
Note. NSW land strikes only. Most lightning, around 90%, is negative: it brings negative charge from the lower part of the cloud to the ground. Positive strikes come from the top of the cloud, often from the anvil, and can land kilometres from the rain. They’re rarer and usually stronger. Over these storms Blitzortung recorded a similar share of each: 5.7% of the 18,579 positive strikes and 6.6% of the 139,410 negative ones.
Strength barely changes how closely the two networks agree, and what change there is goes the other way to what you might expect. Across all 24,128 strikes paired on land and sea, stronger strikes sat slightly further apart (Spearman ρ = 0.11). The median gap is 2.8 km for strikes under 10 kA and 3.6 km for strikes over 60 kA. For the 10,234 NSW land pairs the pattern is the same (ρ = 0.15). Both correlations are statistically real because there are so many points, but they’re weak.
Stronger strikes were located with more Blitzortung stations (ρ = 0.23), but the two networks still didn’t agree more closely. Extra stations heard from far away don’t seem to help. The gap seems to come mostly from where the stations sit and how each network does its timing, not from how loud the signal is.
Figure 6
Distance Between Paired Strikes Against Peak Current
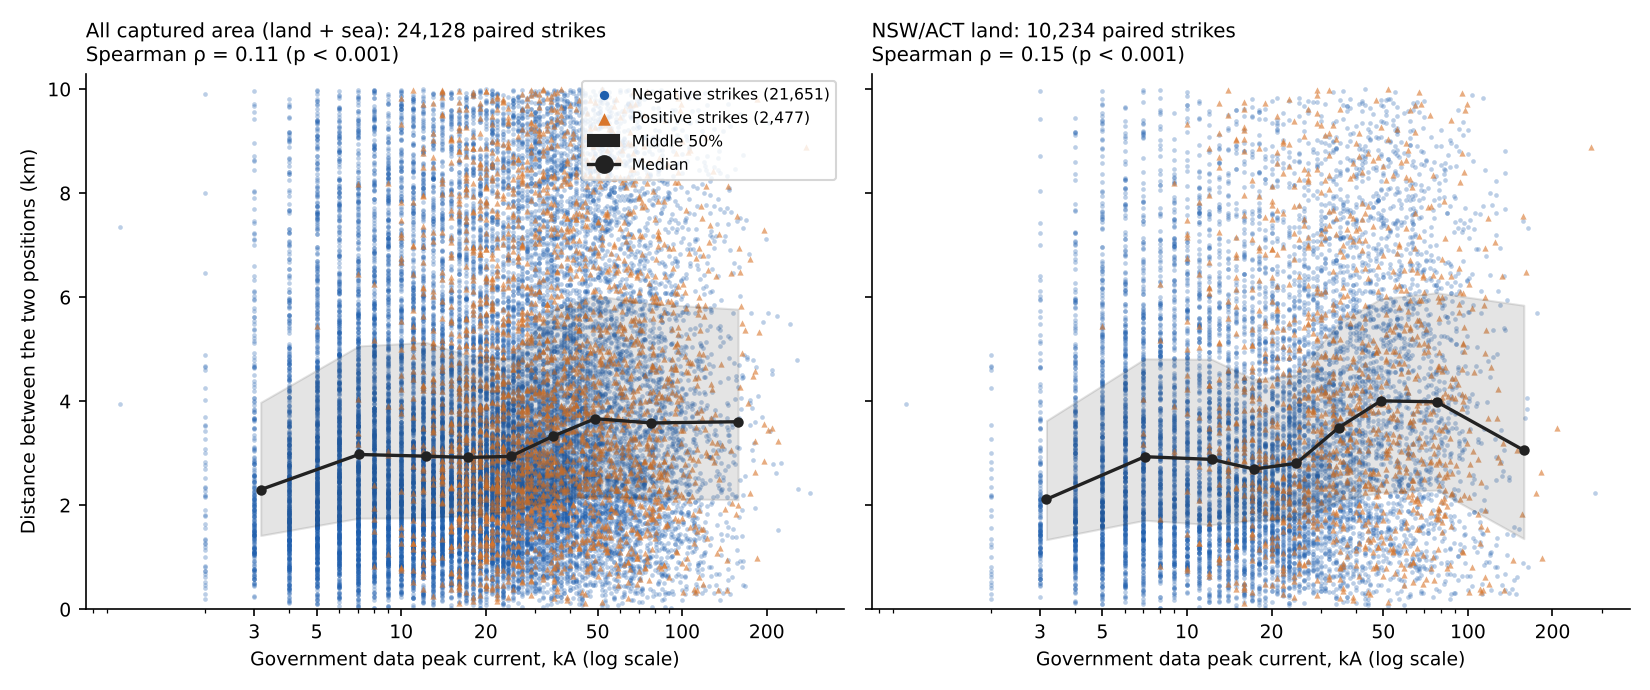
Note. Blue dots are negative strikes and orange triangles are positive strikes. The black line and grey band show the median and middle 50% in each strength band. The left panel includes strikes over the sea; the right panel is NSW land only.
MUDGEE
Three storms crossed the Mudgee box during the comparison: one early on 3 November, a big one on the evening of 14 November, and another overnight into 15 November. The 14 November storm was the busiest, with 1,080 government-data strikes, mostly in a band south of Mudgee from Hargraves west towards Wellington, and Blitzortung caught only 93 of them. Overnight it did better, with 65 of 280.
When both networks caught a strike near Mudgee, they agreed more closely than anywhere else in the comparison. The median gap was 2.0 km, and 24% of pairs were within 1 km. The scatter is stretched north–south, and on average Blitzortung put strikes 2.1 km south of the government data. Figure 9 shows the same southward shift across most of inland NSW.
Figure 7
Strikes in the Mudgee Box
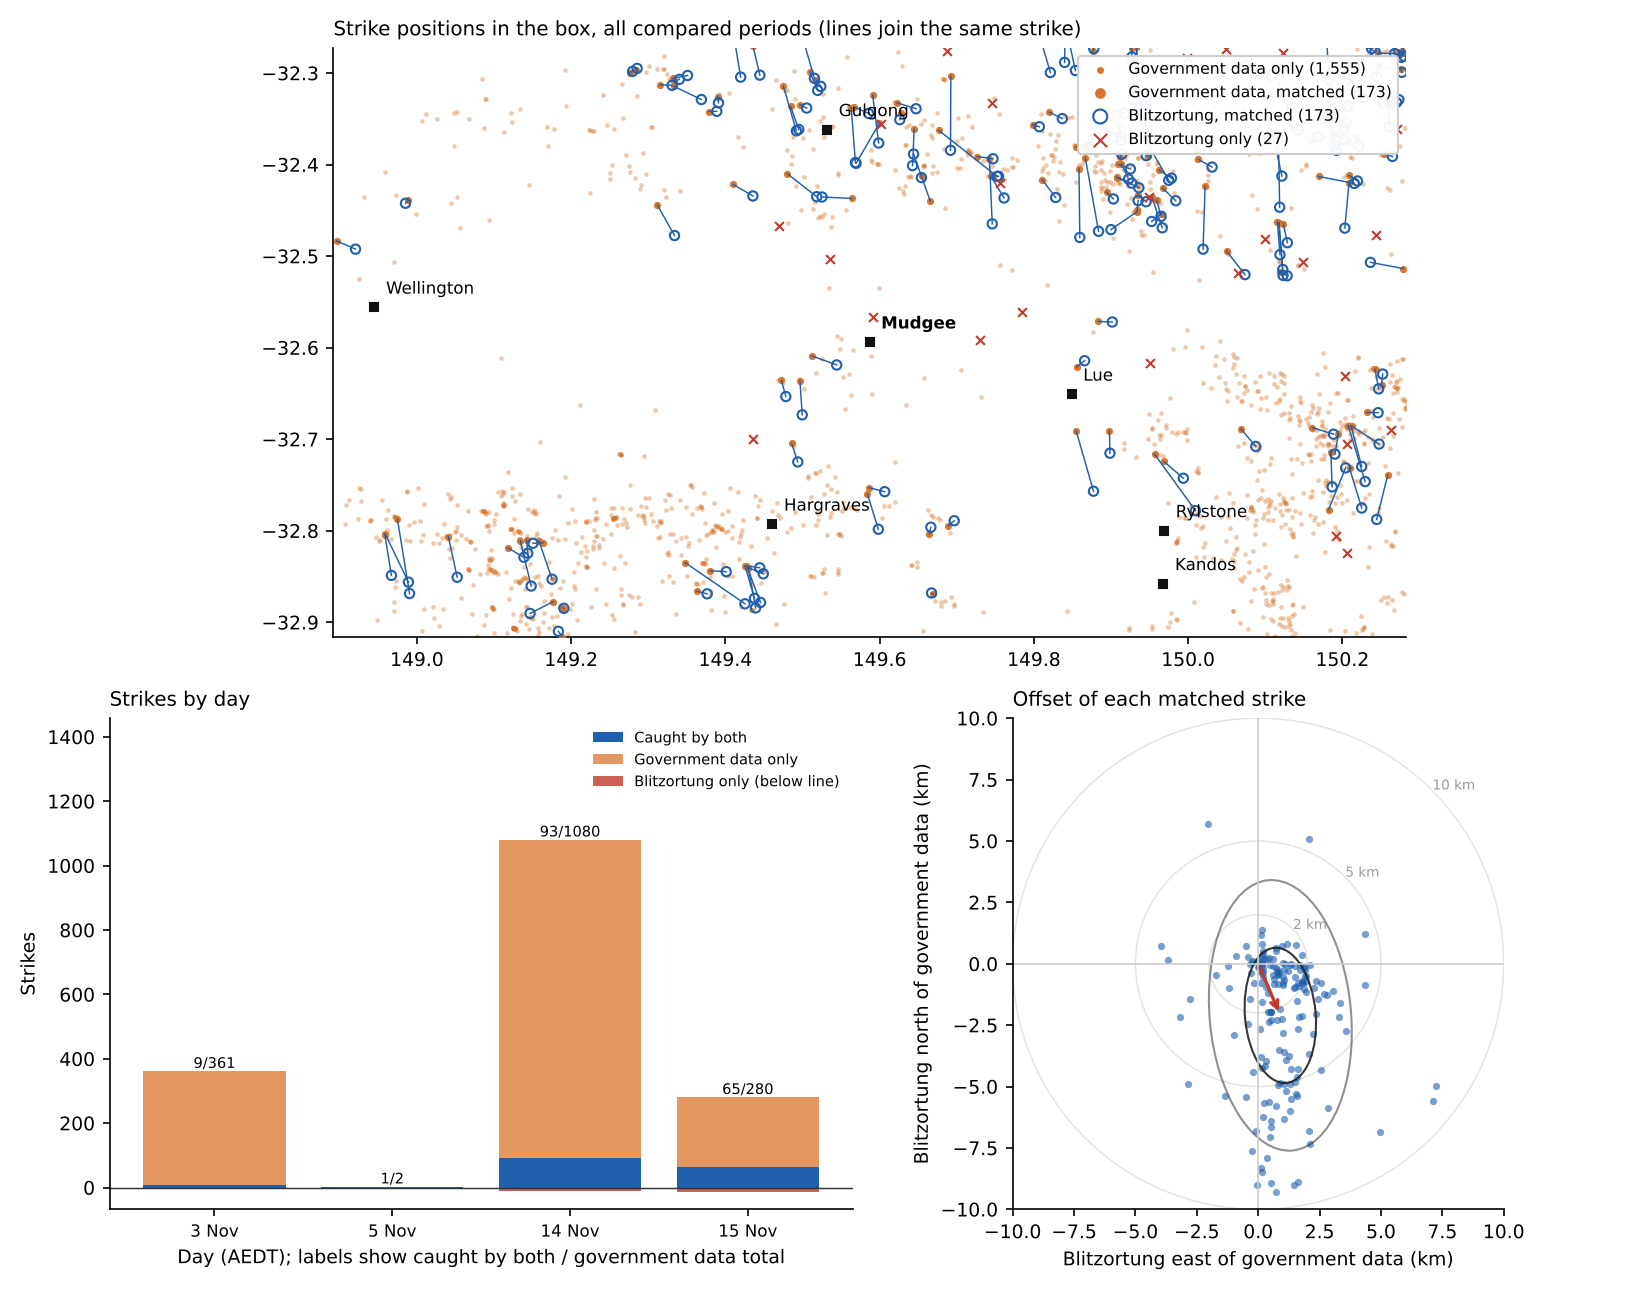
Note. Top: strike positions, with lines joining the two networks’ positions for the same strike. Bottom left: strikes by day, split into caught by both, government data only, and Blitzortung only (below the line). Bottom right: Blitzortung’s position relative to the government data for each pair.
SYDNEY
Storms crossed the Sydney box on 3, 13 and 14 November, including heavy activity around Richmond, Penrith and offshore east of the city. Blitzortung did better at catching strikes here, 13.9% against 9.8% around Mudgee, which fits having several stations in and around Sydney. Its positions agreed less closely, though, at a median of 3.2 km. The scatter here is stretched more east–west, and the average shift is mostly to the east, 2.2 km, with only 0.9 km to the south.
Figure 8
Strikes in the Sydney Box
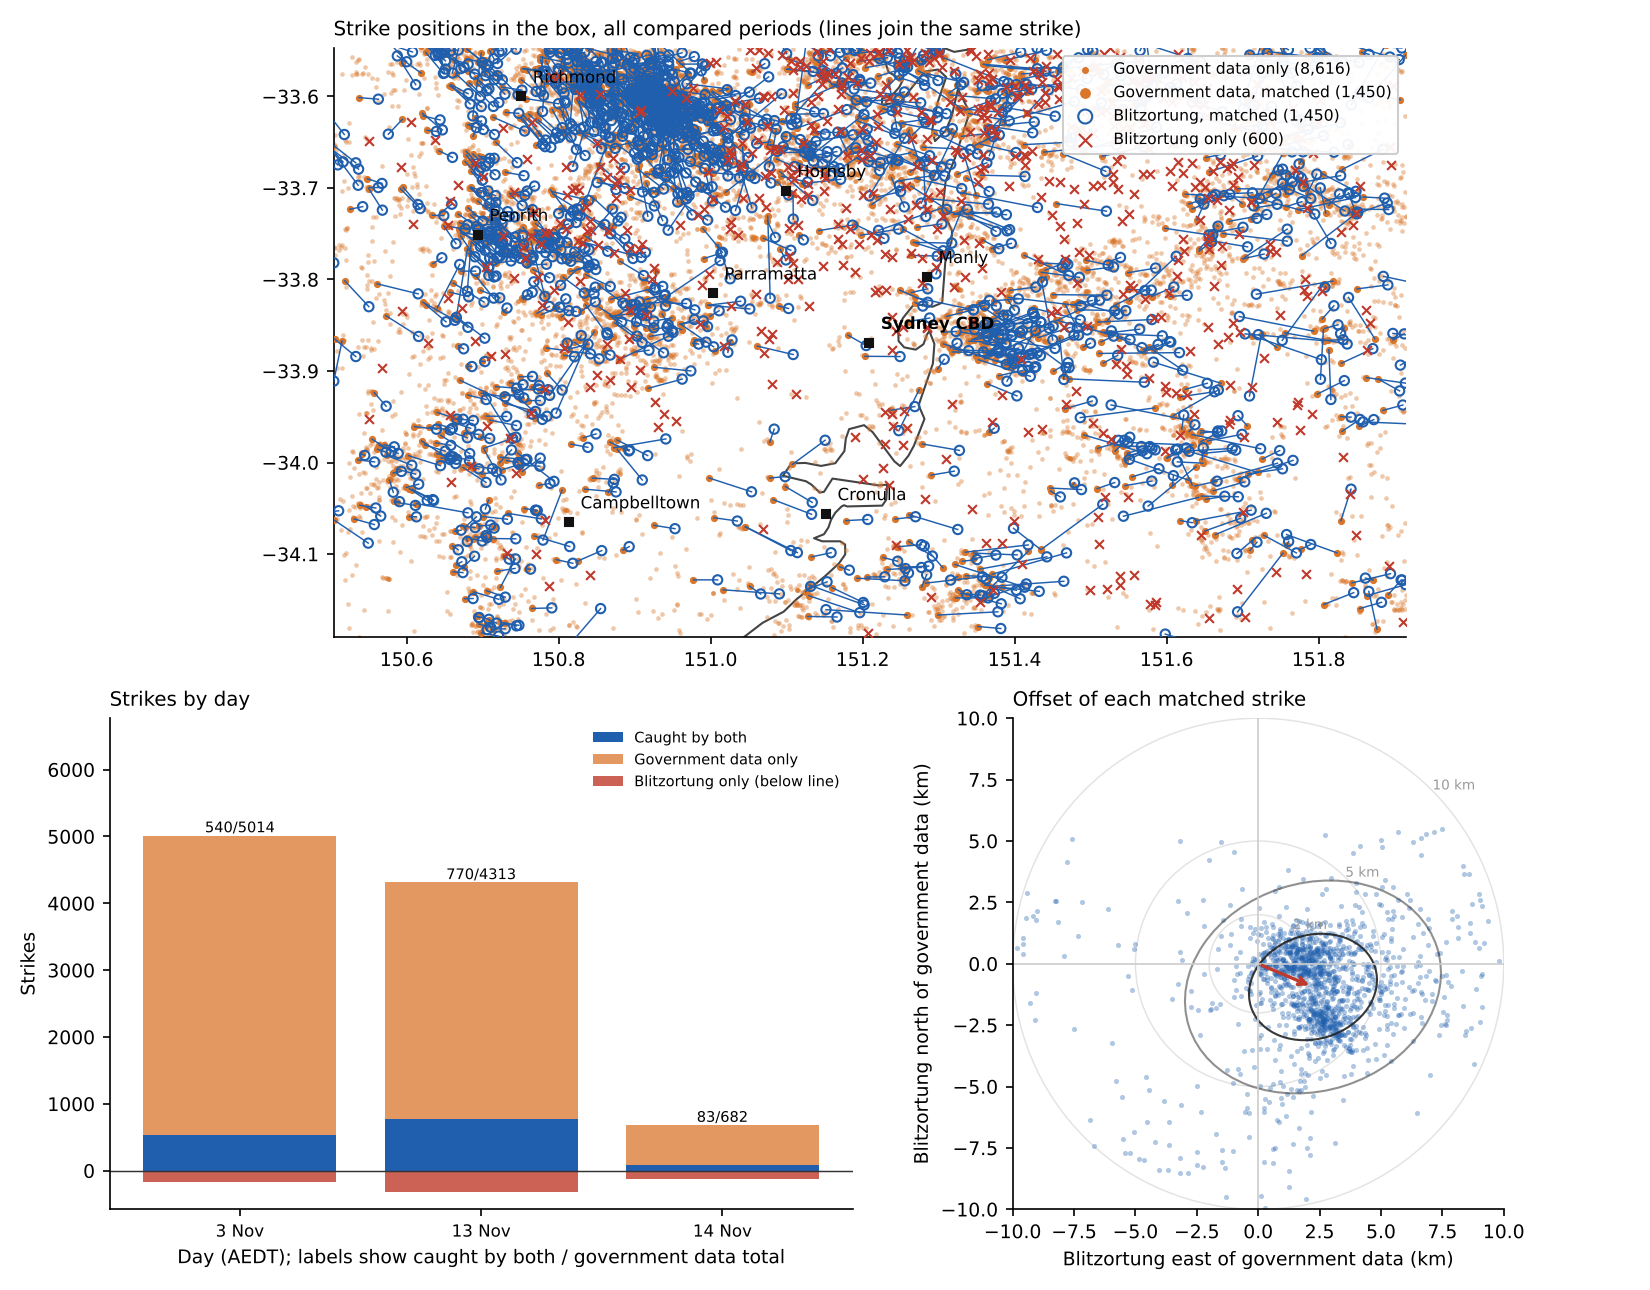
Note. Panels are laid out as in Figure 7.
WHY THE DIRECTION CHANGES
Blitzortung doesn’t know when a strike happened, only when each station heard it, so it has to work out the place and the moment together. If a strike moves a few kilometres away from most of the stations, it gets further from all of them by about the same amount. Every station hears it a little later, which looks the same as the strike simply happening a little later, so the network can barely tell it moved. Movement across that line is easy to spot, because stations on one side hear it earlier and those on the other side later.
The station lists show where the stations were. For strikes in the Mudgee box, 75% of the stations used lay to the south-east, south or south-west, and only 9% to the north, north-east or north-west. So north–south position is the hard direction there, which matches the north–south stretch. For the Sydney box, 49% lay to the south-west and 12% to the west, and the stretch there runs closer to east–west. Half the stations used were 270–1,080 km from the Mudgee strikes, and 130–1,090 km from the Sydney strikes.
FUTURE WORK
The shift between the two networks isn’t random. It changes smoothly across the state, as Figure 9 shows. West of about 149°E, Blitzortung sits 2–4 km south of the government data. Along the north coast it sits east. Around Sydney and the Central Tablelands it sits south-east. A pattern this regular most likely comes from the station layout, and it could be measured and corrected. With enough paired strikes, each area would get its own average shift, and subtracting it would bring Blitzortung’s positions closer to the commercial network’s.
Two things would need checking first. The shift is measured against the government data, so a correction only makes Blitzortung agree with that network, not necessarily with where the strike really hit. And the shift may change as Blitzortung stations come and go. A true accuracy check needs strikes with a known position, such as lightning-instrumented towers and there are only a few globally, all overseas.
Figure 9
Average Shift of Blitzortung From the Government Data Across NSW
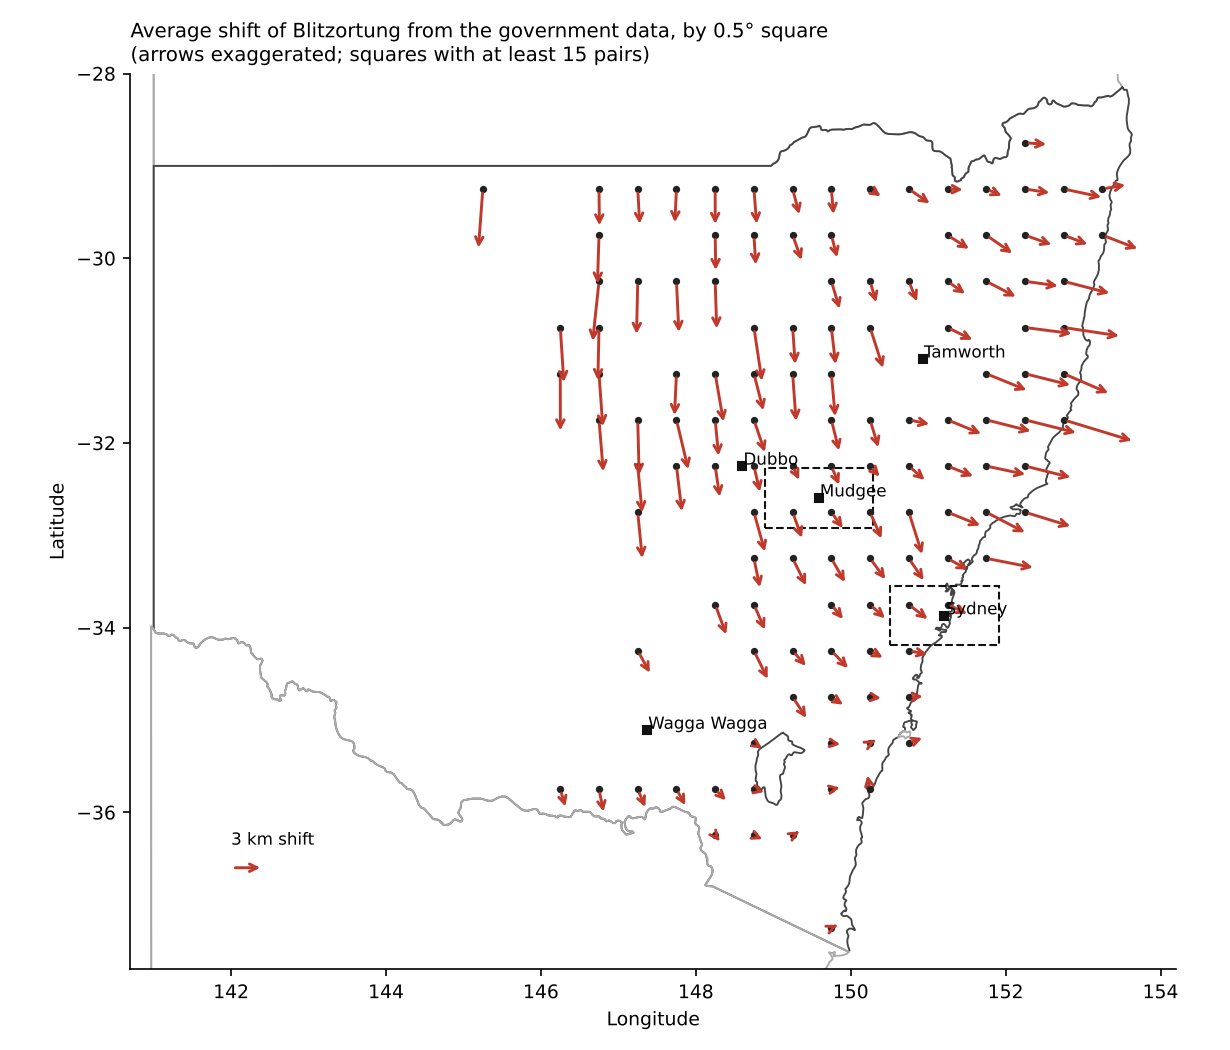
Note. Each arrow is the average shift in a half-degree square (about 50 km) with at least 15 paired strikes. Arrows are drawn longer than true scale; the key arrow shows a 3 km shift.
WHAT THIS MEANS
- The government data records far more strikes than Blitzortung, so it gives a much fuller picture of a storm.
- When both networks record a strike, expect their positions to differ by about 2–3 km, and by up to 7 km for one strike in ten.
- Blitzortung mostly records the stronger strikes, so a weak strike missing from it doesn’t mean there wasn’t one.
- The gap has a direction that depends on where you are. Inland, Blitzortung tends to sit south; near Sydney, east.
- One or two Blitzortung stations inland, north or west of Mudgee, would tighten its positions across the Central West.
LIMITS
This covers 109 hours over two weeks of spring storms. My recording had some small gaps outside of the storm periods, so some Blitzortung strikes are missing from the comparison periods. About 3–7% of pairs may be chance coincidences in busy storms. The government data doesn’t state its accuracy, and we don’t know where its ground stations are. It almost definitely comes from a commercial network, its own error is probably a few hundred metres, which would make most of the gap Blitzortung’s, but this data can’t prove that.